Reported Incidents: Week of Oct 26–Nov 1, 2026
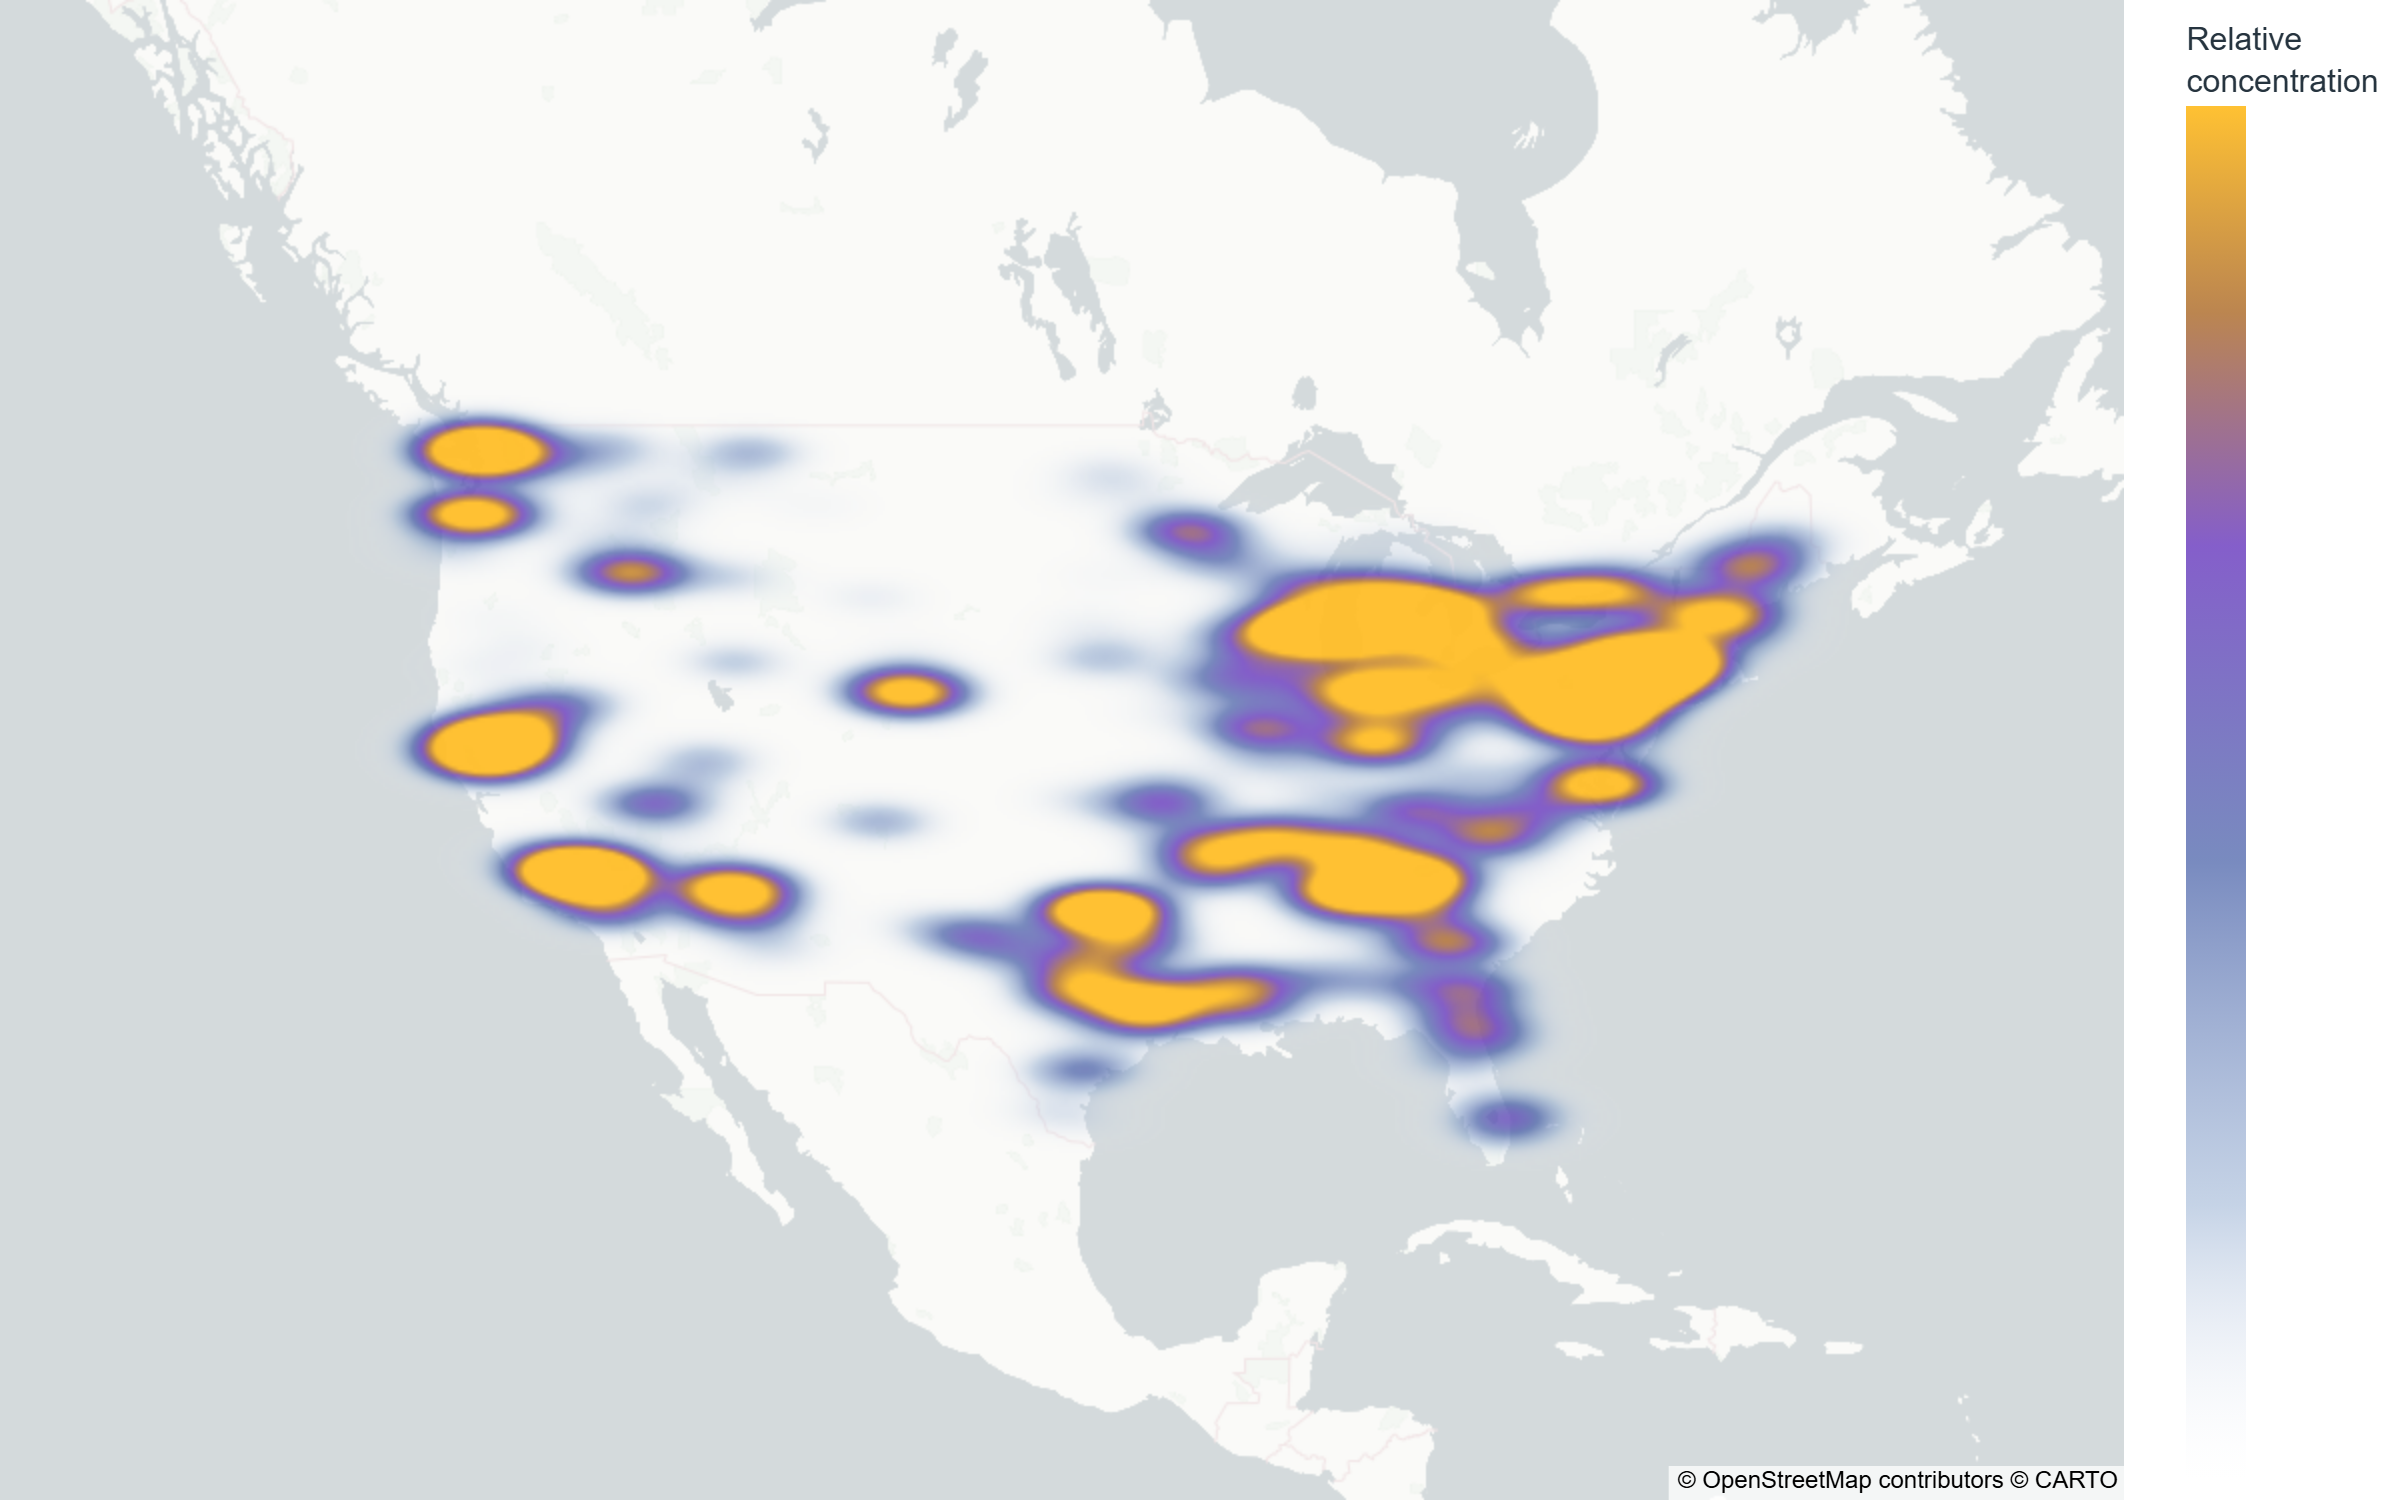
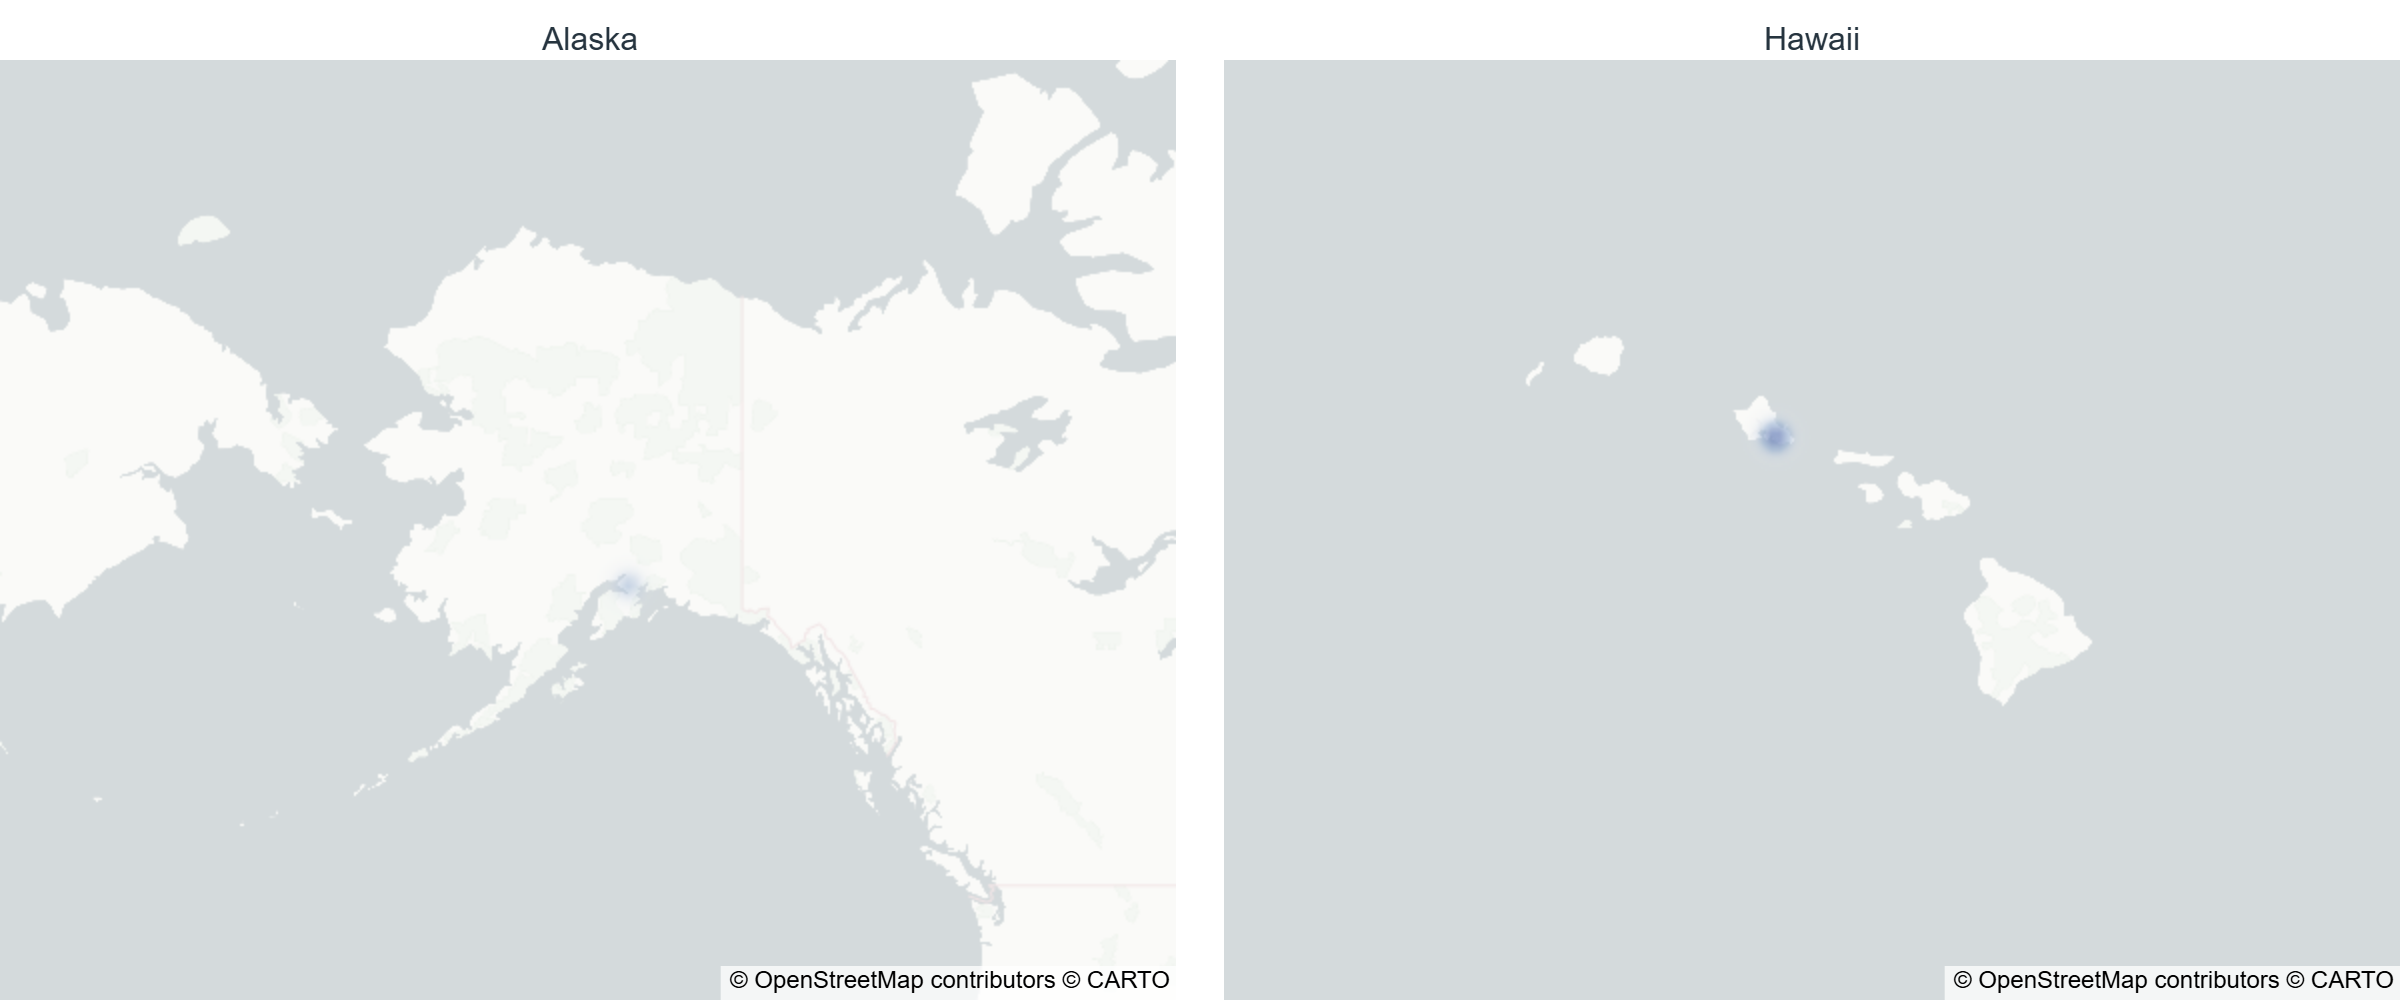
This map shows relative concentration only — a smoothed density surface built from city/region-level data, not individual incident locations. Nothing below state level is named anywhere on this page; city- and neighborhood-level detail is available in the Consilium app. Alaska and Hawaii are shown at their own scale — see the note below on why.
Consilium tracked reported incidents nationwide for the week of October 26 to November 1, 2026. Reported activity is in line with the trailing 4-week average.
State & territory breakdown
Relative to other states/territories this week — not a count of reports, for the same reason the map shows density rather than incident-level detail.
| State/territory | Reported activity |
|---|---|
| California | Elevated |
| Texas | Elevated |
| Pennsylvania | Elevated |
| Illinois | Elevated |
| New York | Elevated |
| Georgia | Elevated |
| Michigan | Elevated |
| Washington | Elevated |
| Ohio | Elevated |
| Florida | Elevated |
| Alabama | Elevated |
| Maryland | Elevated |
| Arizona | Elevated |
| Indiana | Elevated |
| Arkansas | Elevated |
| Virginia | Elevated |
| Oregon | Typical |
| Tennessee | Typical |
| Idaho | Typical |
| Massachusetts | Typical |
| Colorado | Typical |
| North Carolina | Typical |
| Minnesota | Typical |
| Louisiana | Typical |
| Nevada | Typical |
| Maine | Typical |
| Missouri | Typical |
| Kentucky | Typical |
| New Jersey | Typical |
| Wisconsin | Typical |
| Utah | Typical |
| Montana | Typical |
| New Mexico | Lower |
| Nebraska | Lower |
| Iowa | Lower |
| Delaware | Lower |
| Oklahoma | Lower |
| Hawaii | Lower |
| Wyoming | Lower |
| Rhode Island | Lower |
| Connecticut | Lower |
| West Virginia | Lower |
| Mississippi | Lower |
| South Dakota | Lower |
| North Dakota | Lower |
| Kansas | Lower |
| Vermont | Lower |
| South Carolina | Lower |
| Alaska | Lower |
This map is a density visualization, not a precise or exhaustive count by location — it shows where reported activity is concentrated, not a lookup tool. Reported-incident counts are typically incomplete for the most recent 1–2 weeks pending agency finalization and may be revised in later reporting. Category definitions vary by reporting source. Alaska and Hawaii are shown in a separate inset at their own map scale rather than the contiguous-US view, the same approach used on the earthquake report. For more on what "reported" does and doesn't mean, see our data literacy guide.
Want city- or neighborhood-level detail? That level of lookup is available in the Consilium app's civic intelligence features.
Download Consilium
Get city- and neighborhood-level civic intelligence in the Consilium app.
